The nation of Gridlandia is trying to draw voting districts for its upcoming elections. The rules are that there must be four districts and each district must be made up of four contiguous units. (Basically, each district looks like a tetris piece.) Since Gridlandia is laid out neatly in a four-by-four grid, it's not too hard to write down all of the valid plans. There turn out to be only 117 of them.
We can impose a graph or network structure to organize the collection of all of those 117 districting options. We'll let each valid plan be represented by a node in this network, and we'll connect two nodes with an edge if the plans they represent are related by a simple swap move, exchanging the district assignments of two cells from adjacent districts.
We call this structure the metagraph of districting plans. ("Metagraph" because it is a graph whose nodes represent ways of partitioning another graph.) Since Gridlandia itself is so symmetric, it might be useful to consider two districting plans to be the same if they are equivalent after a rigid motion like a rotation or a flip. For example,
If we do collapse the metagraph in this way (in mathematical terms, if we quotient by the action of the dihedral group D4) we are left with only 22 nodes, and we will call that smaller object a reduced metagraph.
All the ways to district Gridlandia
Below, you can interact with these mathematical objects— if your screen is big enough, they are side-by-side. On the left you can manipulate the full metagraph of Gridlandia. On the right you see the reduced metagraph where plans which are related by symmetry are merged into the same node, and two nodes are linked by an edge if any two of their representatives are adjacent in the full metagraph. Mouse over a node in the left-hand graph to see the corresponding plan and highlight all of the other nodes corresponding to symmetrically equivalent plans. Click a node to highlight all of its neighbors. Clicking a node in the right-hand graph will highlight all nodes in that symmetry class from the larger graph, plus their neighbors.
Nodes in the full metagraph are sized according to their degree, or number of neighbors. Nodes in the reduced metagraph are sized according to the number of representatives in their symmetry class.
Elections in Gridlandia
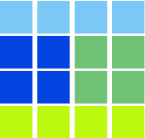
To analyze the partisan performance of a districting plan $\mathcal D$, you must also specify a vote distribution $\Delta$. So let's think about voting in Gridlandia. Gridlandia has plurality elections and two political parties, the Hearts Party and the Clubs Party. For simplicity, we'll start by assuming that everyone in the same grid unit votes the same way—either for the Hearts candidate or the Clubs candidate. Within each district, the party with the most votes wins the election, and ties are left ambiguous—nobody wins. Below, you can click each grid unit to toggle its vote between the parties. On the left, the nodes in the metagraph will change color to indicate which party wins more seats under the corresponding plan. A node will remain gray if it has the same number of Hearts- and Clubs-favoring districts.
Vote Distribution $\Delta$
Click cells to toggle
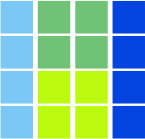
Let's make things a little more complicated. Instead of each unit voting entirely for one party, we will give it a balance of Hearts and some Clubs supporters, in 10% increments. The same electoral rules apply. Left- or right-click on each unit to adjust the balance of Clubs and Hearts supporters.
Play around with this!
- What happens when the Clubs party has a slight majority in most of the cells but a few are heavily Hearts?
- Can you find a distribution of voters where one party has less than half of the votes but still wins three out of four districts?
- Can you find a distribution of voters that creates a Hearts-colored metagraph node surrounded entirely by Clubs nodes?
Vote Distribution $\Delta$
Click cells to adjust balance
If we're interested in studying redistricting in the real world, we'll need techniques that work on much, much more complicated graphs. We will develop some of these techniques using the 5x5 grid, which already has a substantially larger universe of valid districting plans.